Moving away from Flash: A look at JavaScript drawing libraries

Excerpts from a new post for WP’s @innovations blog:
[Go to the blog to read the whole thing]

When Apple announced early last year that it would not support Flash on the iPhone and iPad, a passionate conversation erupted in the world of web development: Was Flash dead? If not, how would it survive? When should it be used? News developers asked these questions as well, and, at least in our newsroom, the conversation inspired some thinking about how to approach interactive development. Over the past year and a half, there has been steady movement toward more interactivity based on JavaScript and fewer Flash-only experiences.

Sorting out the budget proposals

Last week we published a graphic that compared four federal budget proposals through a series of charts. We used the jQuery library Flot to draw simple, interactive line charts that showed how the debt and deficit would change under the different plans. Flot is very easy to use, flexible and customizable, and is one of many free-to-use JavaScript graphing libraries out there (Dracula, Highcharts and RGraph are a few others). We also built a customized chart with CSS and JavaScript at the bottom of the page to show how different categories of spending would be affected.

Read the rest of the article…

Recap from Malofiej 19

Malofiej
Photos: Malofiej 19 at the University of Navarra

In March, I set out for Pamplona, Spain, to join the jury of Malofiej 19. For three days, we judged hundreds of entries in the digital contest, while colleagues on the print side saw over 1,000 entries. Check out the awards here.

Other jury members came from all over the world — Germany, Argentina, Chile, Spain, Italy, and the United States. I met a ton of awesome people who share a passion for infographics and alternative forms of storytelling. Gert Nielson keeps a good log of the goings on at his blog, Visual Journalism. Kaitlin Yarnall of National Geographic wrote a summary piece for the Society of News Design blog here. Javier Errea, who organizes the event, also wrote a post on his blog (in Spanish).

I really liked Stephen Few’s presentation on Infographics and the Brain — reminding us all to think not only of how we want to present the information, but how it will be perceived. It doesn’t matter how good it looks or how clever we think it is if it misses the basic point: helping people understand information.

I gave my presentation on the power of using social media and user-generated content in graphics. I focused on two types of input — that which comes directly from our users (games, polls, submissions) and that which comes from existing social networks (facebook, twitter, foursquare, flickr). The amount of information out there is incredible, and we have to figure out how to use it in ways that show how people fit into their world. The opportunities are endless. Recently some interesting projects have come out that harness some of that power, including the Wall Street Journal’s Foursquare project, a look at check-ins over a week’s time in New York and San Francisco, and the New York Times Bin Laden emotion grid.

For more photos from Malofiej, go here.

Global Warning

A full five months after wrapping the Global Warning project, I think it’s time to do a blog post about it! I spent last fall working with a team of students on a National Security Reporting project at Northwestern University’s Medill School of Journalism. I was an adjunct professor, teaching the students multimedia design and light programming, and serving as the design lead for the project, which was led by Ellen Shearer and Josh Meyer.

After spending a couple of months in the discovery and ideas phases, we decided on several graphics that would address the main topic of the project: How could climate change affect national security?

Read more…

Creating Live Election Results Maps

Live Results: House

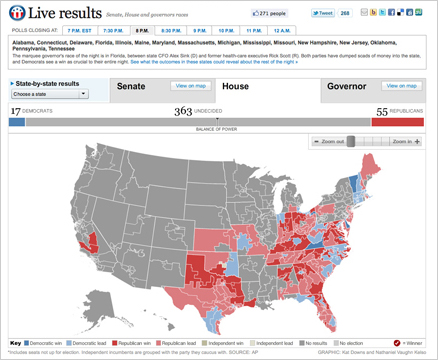
On Nov. 2, midterm election day, we put up these maps that tracked the results as they came in. For Senate and Governors we had state and county-level data, and we had House districts as well. This suite of maps was published in The Washington Post, as well as on Yahoo! News and the Telegraph (UK). The maps have balance of power charting and tabular results as well as zooming and deep linking features. Read more about how we built the maps »

The Cost of War

TBI Menu

This past Sunday “Coming home a different person” launched, a project I worked on with Whitney Shefte and Alberto Cuadra, alongside reporter Chris Davenport. It features an overview video that covers the increases in traumatic brain injury cases and what doctors are doing to treat it, as well as five case studies of three soldiers and two Marines, and a graphic that explains the science of brain injury.

I initially heard about the story Chris Davenport was working on and thought, wow, this is an amazing multimedia opportunity. I went to Whitney and asked her if she’d like to work on it with me. We huddled with Chris and storyboarded out a basic flow for the intro video and the entire piece — how it would be structured and how we should integrate the graphics with the videos. Read more about how we developed this multimedia piece »

Alternative story formats: Investigation into Alaska native corporations

Two Worlds
Two Worlds

This investigation, which launched September 30, focused on Alaska Native Corporations and their explosive growth during the last decade. I combined photos, graphics and video in a multimedia slideshow. The intention was to build a relationship between the corporations and the shareholders they represent. Alaska natives are some of the nation’s poorest people, and some of the corporations that were supposed to be helping them make their way have instead been funneling money back to contractors in Washington.

Read more and see screen grabs »

Live results widget

Primary Results Widget

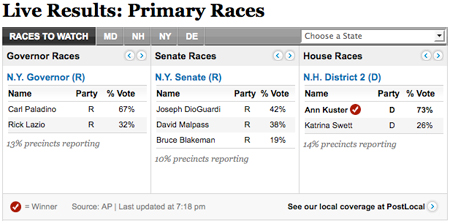
In preparation for the September 14 primaries, I designed this widget for the Politics front. It features house, senate and governors races that auto advance, as well as races to watch, and allows you to see all the races in one convenient spot. It was actually built out by a contractor, Zvi Band of SkeevisArts. We used it on the politics front as the live results came in, and will be able to re-purpose it for future elections.

Liquor sales and consumption

Liquor sales

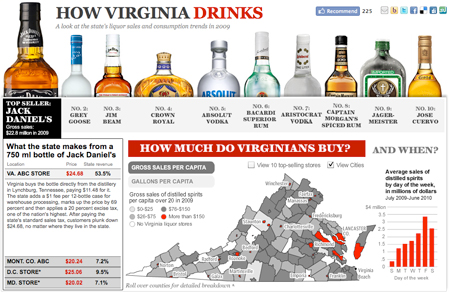
This piece on liquor sales and consumption in Virginia features the 10 top-selling liquors in the state, as well as a tax breakdown and a map showing which areas are purchasing the most liquor. I think looking at the top sellers is interesting — to see that Aristocrat sold more than Jose Cuervo or Captain Morgan. It was a quick-turnaround, fun piece that paints a picture of how Virginia drinks.