Say What? Interactive transcript player tool is a new way to tell speech stories

Ryan speech

Yesterday, we launched a new project: an interactive transcript player that matches up the words of the speech, Post analysis, and reaction from Twitter.

I have been wanting to do a Twitter project for a while, and this time all the pieces fit together. After I pitched the idea, Cory Haik coordinated a partnership with VoterTide, a great company in Omaha that does aggregation and analysis of Twitter trends specifically around politics, that made the Twitter analysis segment possible. I designed the piece, and we were able to get two awesome developers, Leslie Passante and Jeremy Bowers, to build it.

My favorite things are the ‘watch highlights’ view, where you can see all the Post analysis and skip everything else, and the addition of the social layer. Here’s an excerpt from the ‘Ask the Post’ blog post we put together on it:

… VoterTide will provide user reactions as they happen on Twitter, and we’ll match that to the moment in time these reactions occurred during the speech. We will package these reactions to reveal insights into the nation’s response to the conventions and their most-watched speeches.

We’ve gotten some great reaction from this project on washingtonpost.com and on Twitter. It was also written up by Poynter:

So as the GOP nominee took to the podium and the president prepares to do the same at next week’s DNC, it is appropriate that journalists roll out the coolest newest thing. The Washington Post did just that.

“Some innovations we have done, you step back and say, ‘That was fun.’ And some you might say, ‘We produced a new story form.’ But this time I think we can say both,” Haik said.

Totally agree! And we just did another one for Mitt Romney’s speech. This project would not be possible without the awesome producers who put it together: Haley Crum and Mary Keister. Check it out!

New year, new post

It’s been a busy few months, but I’m gonna squeeze in a post for January! I’ve switched jobs at the Post and moved into a new role, Interactive Projects Editor, focusing on creating interactive projects that combine design and graphics with video, photography and social media. I’m really looking forward to the new challenge. In other news, I’m getting used to the new delicious and trying out this ‘stacks’ thing. I’ve got a few going, namely one on interactive maps and one for games and quizzes. I’ll keep those updated as I collect links around the web. And, some of my recent work….

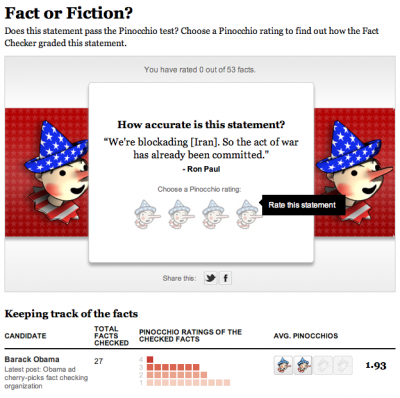
Pinocchio tracker
The tracker part of this was originally done with Tableau, but we decided to rework it and to add a game element to it. It’s on a page of its own as well as in the right rail on all our politics content. Try it out!

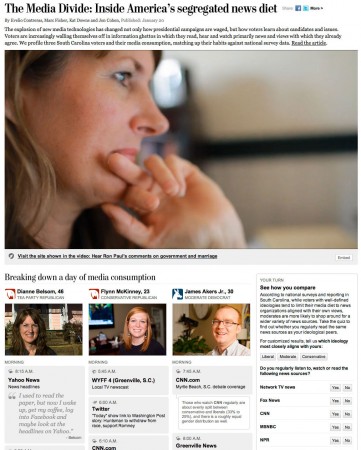
The Media Divide
This piece was born from a project by Marc Fisher to track what media people consume in a day and see how it reflects their ideology. Evelio Contreras did this great video and we put it together in a calendar with links to all the news they watched/read/listened to, and combined that with a poll.

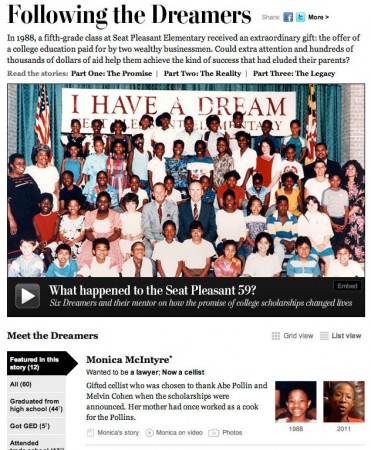
The Seat Pleasant 59
This project leads with Whitney Shefte’s awesome video about a class of students who were promised that if they graduated from high school, their college would be paid for. We tracked down the students and found out where they are now. My contribution was the list/grid view and filtering along with itemizing content for each of the dreamers.

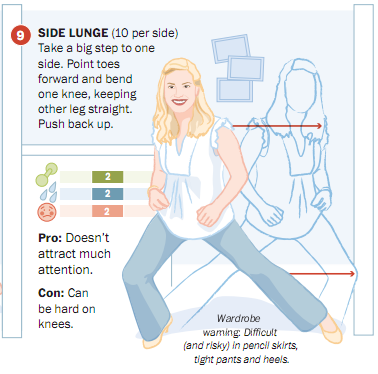
A workout at work and/or my 15 minutes of fame

To create this graphic about exercises you can do at the office, the entire graphics department of the Post got together twice a day to do the exercises. It was a hilarious group activity — we attracted a lot of stares from passersby in the newsroom. I really enjoyed jumping around a little bit in the middle of the day to get the blood pumping.

The graphic was a fun collaboration between Laura Stanton, who illustrated many of the department members, Sohail Al-Jamea, who created the animations, Bonnie Berkowitz, who was our exercise leader and researched and wrote all the text and conducted the survey, and me — I helped design and build the interactive and set up the videos and polls.

So far we have had a lot of people voting — about 1,700 for the first exercise. It’s fun to see how people have responded to each exercise, and we’re hoping it is promoting engagement with the piece.

Global Warning

A full five months after wrapping the Global Warning project, I think it’s time to do a blog post about it! I spent last fall working with a team of students on a National Security Reporting project at Northwestern University’s Medill School of Journalism. I was an adjunct professor, teaching the students multimedia design and light programming, and serving as the design lead for the project, which was led by Ellen Shearer and Josh Meyer.

After spending a couple of months in the discovery and ideas phases, we decided on several graphics that would address the main topic of the project: How could climate change affect national security?

Read more…

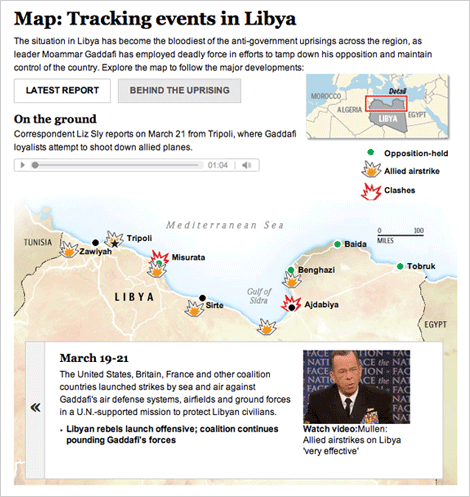
Mapping the news: Libya and Japan

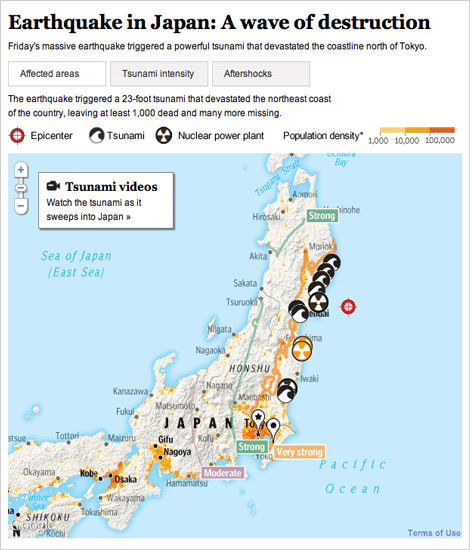
The past several weeks have been full of foreign news, and we have been producing lots of graphics to explain what’s happening. I have worked on these two graphics, one about the earthquake and subsequent tsunami in Japan, and one that explains what is going on in Libya.

For a full explanation of the process of creating the Japan graphic, visit the new Innovations blog at the WP (excerpted below):

Friday morning, as news of the earthquake in Japan spread, we started pulling together an interactive map that would show readers where and how events unfolded. Over the next 36 hours, we would continually expand and improve the information, design and interactivity of the map as the news of the earthquake and tsunami came in. Read more »

For Libya, we combined an event tracker with audio and video from the ground. The reports from correspondents on the ground is my favorite part.

Both graphics are done using javascript and jquery, so check them out on your tablet devices!

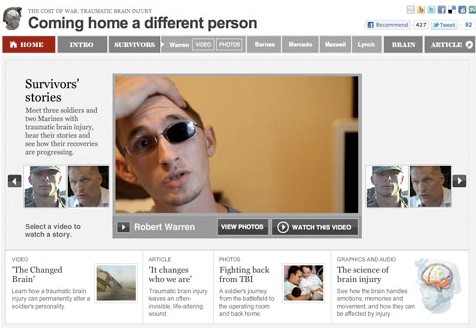
The Cost of War

TBI Menu

This past Sunday “Coming home a different person” launched, a project I worked on with Whitney Shefte and Alberto Cuadra, alongside reporter Chris Davenport. It features an overview video that covers the increases in traumatic brain injury cases and what doctors are doing to treat it, as well as five case studies of three soldiers and two Marines, and a graphic that explains the science of brain injury.

I initially heard about the story Chris Davenport was working on and thought, wow, this is an amazing multimedia opportunity. I went to Whitney and asked her if she’d like to work on it with me. We huddled with Chris and storyboarded out a basic flow for the intro video and the entire piece — how it would be structured and how we should integrate the graphics with the videos. Read more about how we developed this multimedia piece »

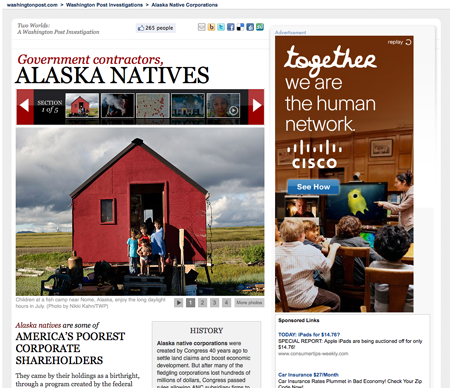
Alternative story formats: Investigation into Alaska native corporations

Two Worlds
Two Worlds

This investigation, which launched September 30, focused on Alaska Native Corporations and their explosive growth during the last decade. I combined photos, graphics and video in a multimedia slideshow. The intention was to build a relationship between the corporations and the shareholders they represent. Alaska natives are some of the nation’s poorest people, and some of the corporations that were supposed to be helping them make their way have instead been funneling money back to contractors in Washington.

Read more and see screen grabs »

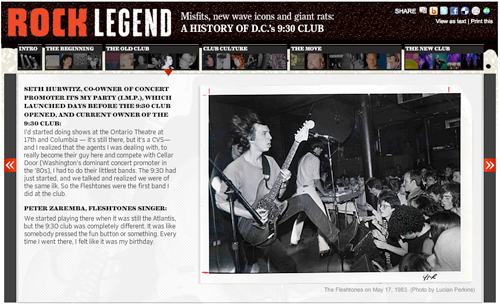
D.C.’s rock scene: 9:30 club turns 30

A multimedia history of the 9:30 club

I spent the last few days working on this piece about the 30th anniversary of the opening of the 9:30 club, one of the best venues in D.C. (and a lot of people would say the whole country). Alex Garcia shot some great concert video and interviewed some key people, and Josh du Lac wrote the magazine story. I pulled it all together in this multimedia slideshow, which has several different text layouts and video in varying sizes. The content of this is the coolest part — there are some great stories in there about the old club: how there were so many rats they had something called the “rat highway,” how Will Smith (The Fresh Prince) showed up and just left without playing the show because he was so disgusted at how the place looked and smelled, and a whole bunch more. There are also some great photos from the ’80s and ’90s. I pulled the illustrations from the magazine layout, which you can see here.