Published in The Washington Post, July 19, 2010
Role: Design, programming
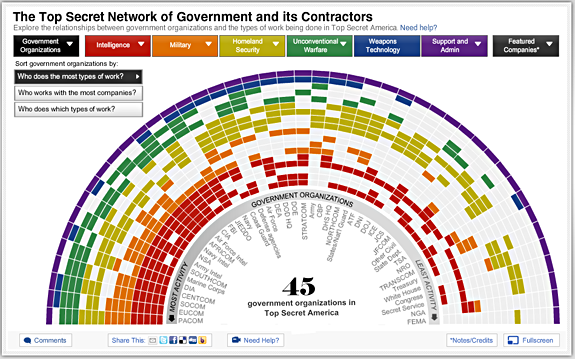
This graphic visualizes the redundancy and relationships in Top Secret America. Specifically, it shows which government organizations do what types of top-secret work, and how many companies they work with. The centerpiece is the color-wheel, which allows users to sort the government organizations in three different ways. It also has individual views of each government organization, work type, and a couple dozen companies. It is all dynamically drawn, fullscreen capable, and utilizes deep linking. For a more complete description, visit my blog. I also helped Nathaniel Kelso with the map for the project, particularly some of the design work and the motion graphics, which I blogged about here.
Tools used: Flash/ActionScript 3.0, Adobe Illustrator, JavaScript, After Effects, Google Maps API
Awards: WHNPA Eyes of History 2011: 2nd Place for Multimedia Package (In-Depth) , 2010 George Polk Award in Journalism (Category: National Reporting), SXSW Finalist for Technical Achievement, Goldsmith Prize for Investigative Reporting Finalist
In the news: Fast Company infographic of the day, Infosthetics: Visualizing the National Security Buildup
