Published in The Washington Post, October 30, 2011
Role: Design, programming
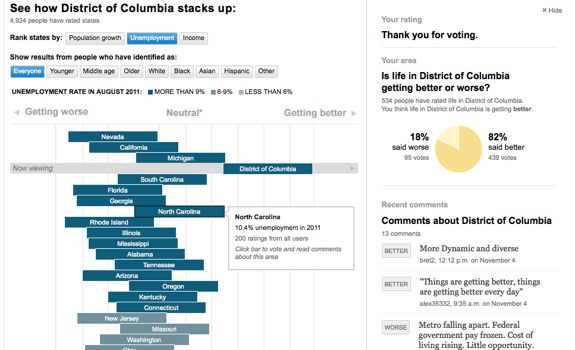
I worked with Dan Keating (database) on this project, which takes a unique approach to user-generated data. It mashes up responses from users with actual numbers on unemployment, median income and population growth to see how people’s perceptions line up with reality. A week after launch we had nearly 5,000 responses. We use IP location to target the experience to the user’s county and state, and ask them to make a rating and, optionally, give us some demographic information and leave a comment. Read more here.
Tools used: JavaScript, jQuery, Quicksand plugin, Echo comments API, Google Visualization API, Bit.ly API, CSS
More user-centered projects: Are you over the hill for Olympic sports?, How does your income compare?
