Published in The Washington Post, September 18, 2011
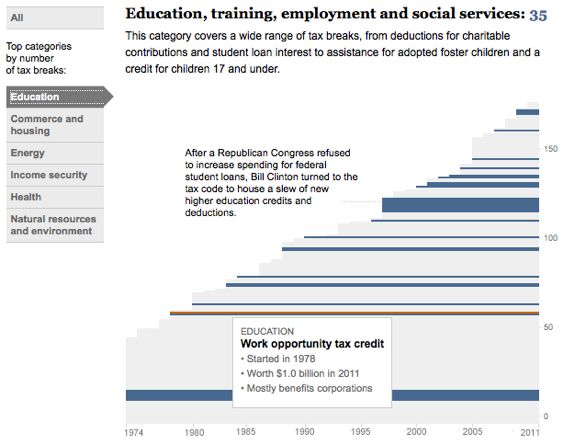
This piece looks at all the tax breaks on the books in the United States, how much they cost and when they went into effect. It breaks down all the tax expenditures by category and value and highlights important movements. I created the charting, interaction and design of the javascript visualization at the top of the page. We focused a lot on adding an annotation layer to this piece, so it’s not just a deep data dive. While the granular information is there, it is secondary to the analysis we are providing. Read more here.
Role: Design, programming
Tools used: JavaScript, jQuery, CSS
More charts: Where are the jobs?
