After a full year of working on various aspects of the Top Secret America project, we have finally launched! Check out the full project at topsecretamerica.com.
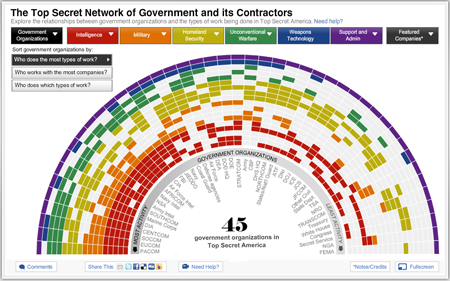
I worked on a whole bunch of aspects of this project and did a lot of brainstorming and storyboarding, but my primary focus was the interactive “network connections” graphic. In the beginning we wanted to create a graphic that illustrated the redundancy and size of Top Secret America and had a ton of data in it, while not being overwhelming. I was inspired by some graphics Laura Stanton had sketched out that had a circular format, and I started exploring ways of drawing and connecting individual and overall views. After several versions, I came up with this combination.
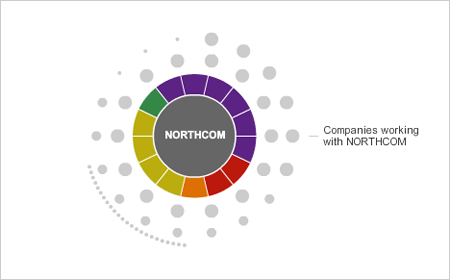
The graphic has a bunch of different formats and views, the main of which is a “color wheel” that allows you to sort the government agencies by who does the most types of work, who works with the most companies, and what type of work they do. The colors each represent a type of work, which is defined in the key at the top (which also doubles as a nav bar). If you select “who does what types of work?” you can filter by work type:
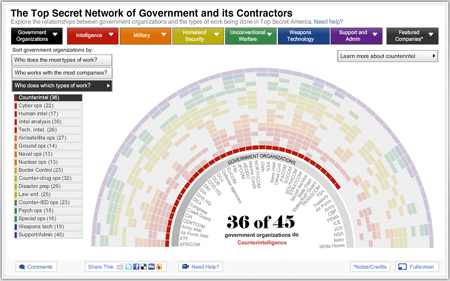
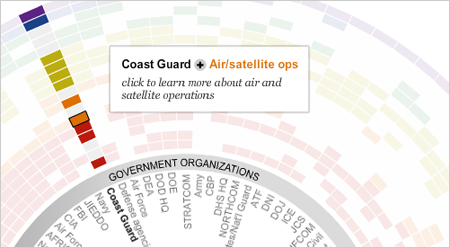
If you hover over the graphic, you will get info boxes that describe what you’re seeing…
Once you click on a segment, you’ll get an individual profile page for the item you selected. The individual view tells you a little about the gov org, function, or company, charts the number of companies that work on/with that work type/gov org, and shows how many companies are working with the center item. There’ s a lot of data in this view, but I like the easy read of the color wheel. If you see an item that interests you there, you can follow the trail endlessly. I like the clicky nature of this piece — you just want to keep looking at it because there is so much to see.
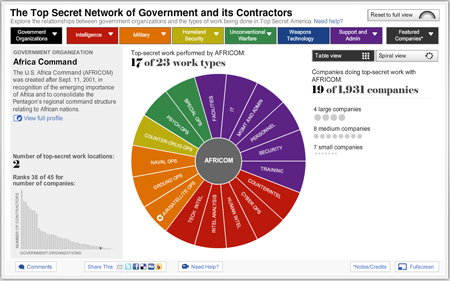
In addition to the “table view,” there is also a “spiral view.” I like the spiral because it gives you a feeling for just how many companies are working with/on each thing. If you continuously click through with the spiral surrounding the center item, you can easily see who has the most companies — it’s interesting to see that circle shrink and expand depending on the center item.
Overall, I really like the way this graphic turned out. It was fun to work on and I think it ended up being interesting and fun to use. I love the way it fits into the entire project, which is an incredible piece of journalism. The stories were researched and written by Dana Priest and Bill Arkin, a couple of amazing people it’s been great to work with these past months. Over the past two years, Bill methodically compiled all the information in the database. Sarah Sampsel did the site design, Ryan O’Neil built the databases, and Lauren Keane was the project editor. Nathaniel Vaughn Kelso also did a cool interactive map.
The graphic and the package have been in the news a little bit. Here are some interesting pieces: Infographic of the Day on FastCompany Design blog, Infosthetics: Visualizing the National Security Buildup in the U.S., At War on the New York Times, Chart porn, GOOD, Flowing Data, VizWorld, and Mediabistro.
Technical note: If you’re wondering how it was built: Everything in this graphic is dynamically drawn and fully fed by the database. I used trigonometry and polar coordinates to draw the circles, arcs, and wedges. I learned a lot about circle drawing math in the process 🙂 The piece is fullscreen-capable and it uses SWFaddress for deep linking.
Fun fact: I voiced the help video. Nice to know I can always fall back on my voice career if I need to 😉
Nice work, Kat!
Thanks Juan! 🙂